Volunteering
The below infographics display 2010 survey data. The latest data on giving and volunteering (2013) is now available from Statistics Canada.
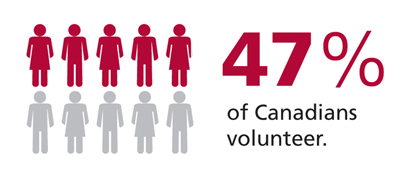
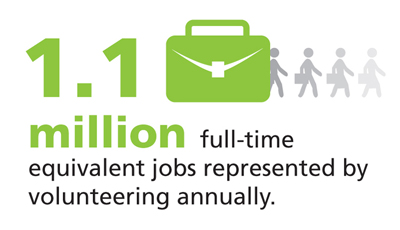
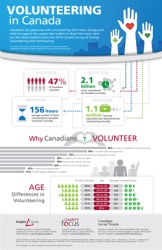
The 2010 stats show that 47% (or over 13 million) volunteer. In total 2 billion hours were volunteered, the equivalent of 1.1 million full time jobs. On average, volunteers contributed 156 hours each (roughly 21 working days).
Demographics
Age: Not surprisingly youngest age group (ages 15-24) represents the highest percentage of volunteers (at 58%). It is interesting to see that folks between 35 and 44 are a close second at 54%. Similar to what we see in financial giving, those who occupy the 65 + category donate the largest number of hours.
Region: Saskatchewan and Prince Edward Island show the highest volunteer rates. Nova Scotia and British Columbia reported the largest average annual hours volunteered.
Why we volunteer
Canadians state that the primary reason they volunteer is to contribute to their communities. The next two major reasons are to use skills and experience and because they have been personally affected by the cause. The breakdown is as follows:
- to make a contribution to community (93%);
- to use skills and experience (78%);
- personally affected by the organization's cause (59%);
- to explore one's own strengths (48%);
- because their friends volunteer (48%);
- to network with others (46%);
- to improve job opportunities (22%); and
- to fulfill religious obligations or beliefs (21%).
More resources
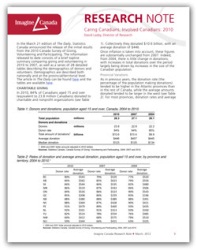
The Canada Survey of Giving, Volunteering and Participating (CSGVP) provides the most comprehensive overview of the contributions of time and money Canadians make to nonprofit and charitable organizations and to each other. Conducted in 1997, 2000, 2004, 2007 and 2010 the CSGVP surveyed a random sample of Canadians about how they:
- gave money and other resources to charitable and nonprofit organizations;
- volunteered time for charitable and voluntary organizations and for individuals directly; and,
- participated in organizations by becoming members.
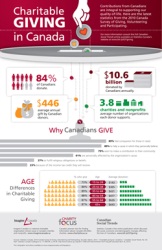
Imagine Canada produced detailed reports for the previous editions of the survey prior to 2010, when Statistics Canada published the results in Canadian Social Trends. Imagine Canada did create supplemental materials for the 2010 Survey - 2 infographics, and the Research Note, seen below.
In addition to the comprehensive Highlights Reports, Imagine Canada's research team also produced many detailed reports and factsheets on specific topical and demographic aspects of the surveys. You can search for all of these resources and more in our Imagine Canada Research database.