Canadians donate their time, money, energy and skills to the causes that matter to them the most. These individuals are the foundational support for Canada’s more than 161,000 charities and nonprofits which in turn support our communities’ social fabric and quality of life.
The below infographics display 2010 survey data. The latest data on giving and volunteering (2013) is now available from Statistics Canada.
Giving by Canadians
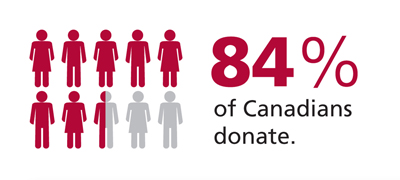
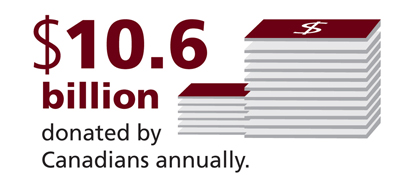
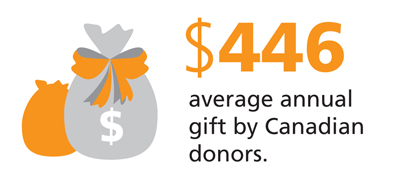
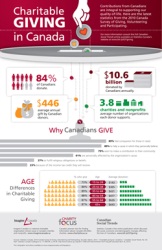
The latest statistics (2010) show that 84% of Canadians aged 15 and over (about 23.8 million Canadians) donated to charitable and nonprofit organizations. The average individual donation is about $446 per year. In total that is $10.6 billion dollars donated by Canadians every year.
Demographics
Age: It is not surprising that the rates of giving (i.e., the percentage of people in a certain category) are highest among those in the 35 - 54 age range (89% of those 35-44 and 88% of those 45-54). The average amounts donated increase with age, where those in the 65+ category give on average $643 annually.
Region : Atlantic provinces have higher numbers of individuals making donations (scaled with the population) than in the rest of Canada. Westerners donate higher than average amounts.
Why we give
It is clear that Canadians are motivated to donate because they care for their fellow citizens and the social impact of the various causes organizations represent. The breakdown is as follows:
- compassion for those in need (89%);
- personally believe in a cause and want to help (85%);
- contribute to our communities (79%);
- personally affected by an organization’s cause (61%);
- religious obligations or beliefs (29%); and
- income tax credit (23%).
More resources
The Canada Survey of Giving, Volunteering and Participating (CSGVP) provides the most comprehensive overview of the contributions of time and money Canadians make to nonprofit and charitable organizations and to each other. Conducted in 1997, 2000, 2004, 2007 and 2010, the CSGVP surveyed a random sample of Canadians about how they:
- Gave money and other resources to charitable and nonprofit organizations;
- Volunteered time for charitable and voluntary organizations and for individuals directly; and
- Participated in organizations by becoming members.
Imagine Canada produced detailed reports for the previous editions of the survey prior to 2010, when Statistics Canada published the results in Canadian Social Trends. Imagine Canada did create supplemental materials for the 2010 Survey - two infographics, and the Research Note, seen below.
In addition to the comprehensive Highlights Reports, Imagine Canada's research team also produced many detailed reports and factsheets about specific topical and demographic aspects of the surveys. You can search for all of these resources and more in our Imagine Canada Research database.
The GIV3 Foundation has produced a map showing levels of giving in selected metropolitan areas across Canada.